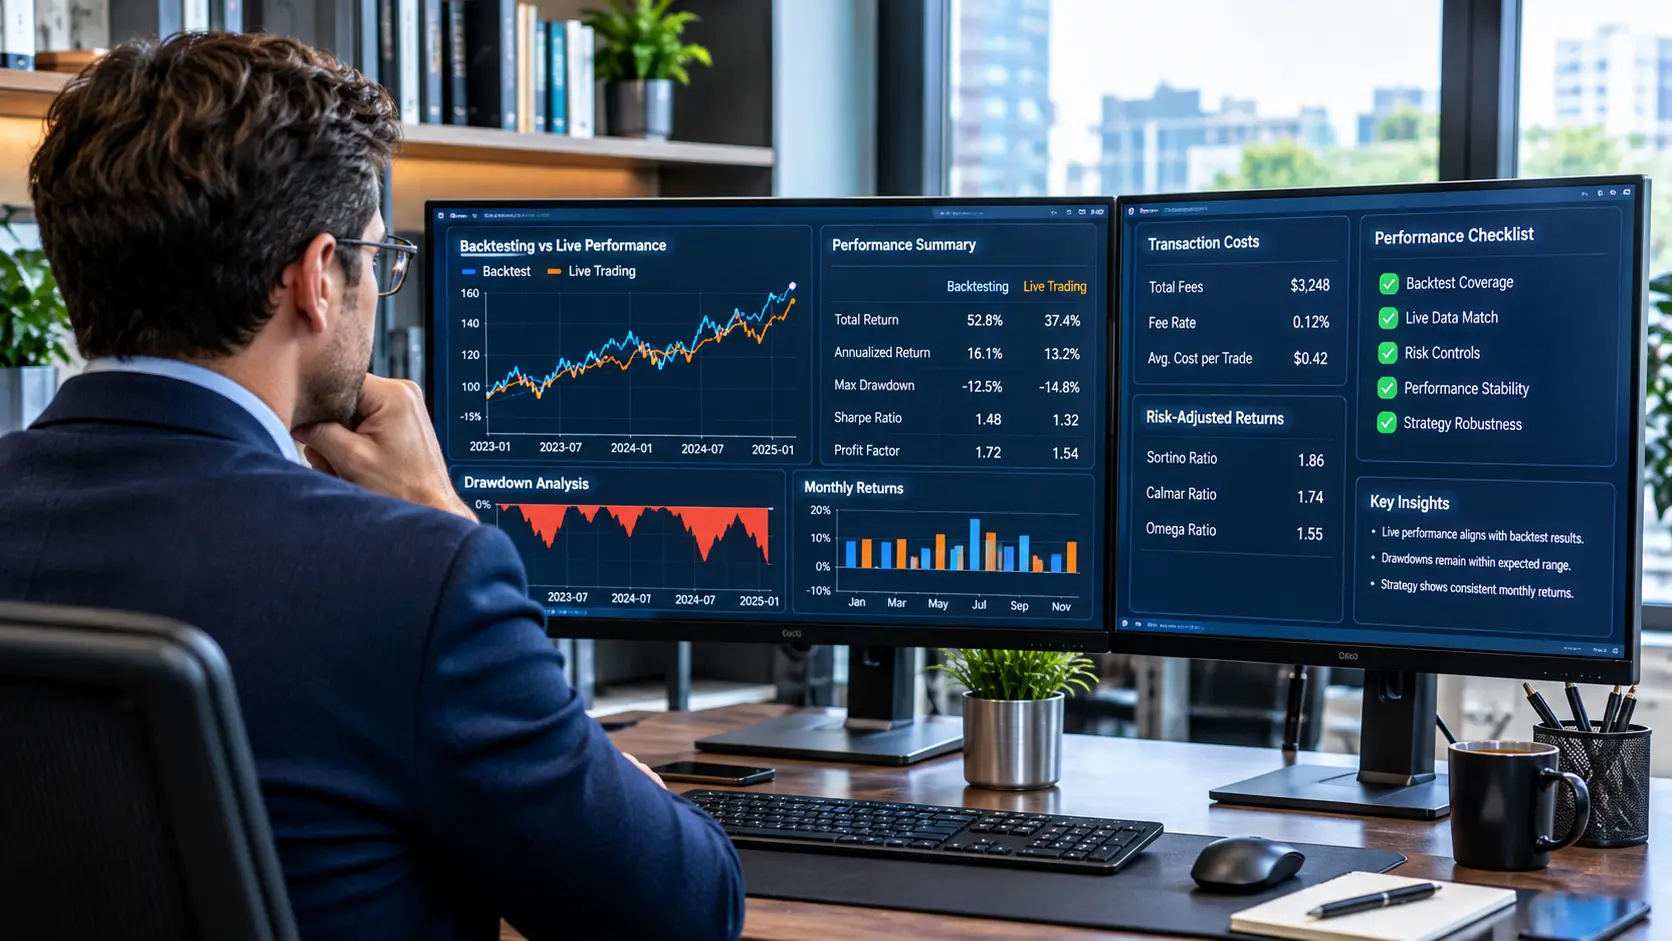
Learning how to evaluate AI trading performance is essential before relying on automated investment software or artificial intelligence-generated trading signals. A platform may advertise sophisticated algorithms, predictive models, or impressive historical returns, but those features alone do not establish reliable trading performance.
A meaningful evaluation examines how results were produced, whether they reflect actual transactions, and how the strategy performs after accounting for losses, trading costs, and changing market conditions.
Investors should distinguish simulated backtesting results from independently verifiable live trading records while remaining alert to misleading performance claims.
What Does Evaluating AI Trading Performance Measure?
AI trading performance measures how effectively a trading system achieves its stated financial objectives over a defined period.
Although investment returns are important, they represent only one part of the evaluation.
A strategy generating high returns may also experience substantial losses or rely on excessive leverage.
Therefore, investors should consider several performance indicators together.
Important measurements include:
- Total and annualized returns.
- Maximum drawdown.
- Trading frequency.
- Transaction fees and slippage.
- Risk-adjusted performance.
- Performance consistency.
- Exposure to market volatility.
- Results across different market conditions.
These measurements provide a more complete understanding of trading behavior than isolated profit figures.
How to Evaluate AI Trading Performance With Backtesting
Backtesting examines how a trading strategy would have performed using historical market information.
Developers typically apply a model’s trading rules or predictions to previous price data and calculate hypothetical results.
For example, an AI trading strategy might be tested against historical Bitcoin prices to estimate how it would have responded to different market conditions.
However, the quality of a backtest depends heavily on its methodology.
Evaluating AI Trading Performance With Realistic Trading Assumptions
A credible backtest should account for factors that affect actual transactions.
These include exchange fees, bid-ask spreads, slippage, and available market liquidity.
For instance, a strategy that makes frequent small trades may appear profitable before costs but become unprofitable after realistic execution expenses.
Additionally, historical price data must accurately reflect the information available when each hypothetical decision occurred.
Understanding Overfitting in AI Trading Performance
Overfitting occurs when developers adjust a model so closely to historical data that it learns patterns that do not generalize to future conditions.
An overfitted AI model may produce impressive backtesting results while performing poorly in live markets.
To reduce this risk, researchers can use out-of-sample testing and walk-forward validation.
These methods evaluate models on observations that were not used to develop or optimize them.
Nevertheless, even carefully designed historical tests cannot guarantee future results.
Evaluating AI Trading Performance: Backtesting vs. Live Results
Backtesting estimates hypothetical historical outcomes, while live results reflect actual market conditions and transactions.
| Evaluation Factor | Backtesting | Live Trading |
|---|---|---|
| Market information | Historical data | Current market data |
| Trade execution | Simulated | Actual |
| Transaction costs | Estimated | Incurred |
| Liquidity conditions | Modeled | Experienced |
| Operational failures | Often simplified | May directly affect results |
| Evidence of real profitability | No | Potentially, if records are authentic and complete |
Live results are generally more informative about real execution, but their reliability still depends on accurate reporting.
A short period of profitable trading does not establish long-term effectiveness.
Similarly, a verified account statement may confirm transactions without proving that a strategy will remain profitable.
Why Maximum Drawdown Matters
Maximum drawdown measures the largest percentage decline from a portfolio’s previous peak to a subsequent low during the evaluation period.
Consider a hypothetical account that increases from $20,000 to $25,000 before falling to $17,500.
The decline from the $25,000 peak represents a 30% drawdown.
Even if the account later recovers, that decline reveals the level of loss an investor might have experienced.
Drawdown analysis is particularly important for automated trading strategies that use leverage or maintain exposure during volatile markets.
Investors should examine both the size and duration of historical drawdowns.
A strategy that takes years to recover from significant losses may be unsuitable for investors who need access to their capital sooner.
How to Verify AI Trading Platform Claims
Investors should evaluate performance statements separately from descriptions of a platform’s technology.
For example, the Hyperlyx trading platform describes a multi-model AI trading intelligence approach.
That description provides information about the platform’s proposed analytical architecture, but it should not be interpreted as independent evidence of trading profitability.
Before relying on any platform’s performance representations, investors should look for clearly identified reporting periods, realistic cost assumptions, documented methodologies, and independently verifiable results where available.
They should also determine whether published figures represent simulations, paper trading, actual transactions, or illustrative examples.
What Counts as Independent Verification?
Independent verification may involve a qualified third party reviewing trading records, account statements, or performance calculations.
However, verification can have different scopes.
An assessment confirming that certain transactions occurred does not necessarily validate a model’s predictive accuracy or establish that the provider is financially regulated.
Investors should examine what was reviewed, who performed the assessment, and whether the findings are publicly accessible.
Warning Signs of Misleading Trading Performance Claims
Certain promotional practices deserve additional scrutiny.
Guaranteed returns: Financial markets involve uncertainty, so promises of consistent profits without risk are warning signs.
Unexplained win rates: A high percentage of profitable trades does not establish profitability if occasional losses are substantially larger.
Selective performance periods: Showing only favorable months can hide prolonged losses or weak market performance.
Missing transaction costs: Results that ignore fees, spreads, and slippage may exaggerate profitability.
Unverifiable screenshots: Dashboard images alone do not establish that real transactions occurred.
Unclear leverage: High returns generated through substantial borrowed exposure may involve significant liquidation risk.
Pressure to deposit quickly: Urgency-based promotions can discourage careful financial evaluation.
These warning signs do not automatically prove misconduct, but they justify further investigation.
Can Risk-Adjusted Returns Provide Better Insight?
Risk-adjusted performance metrics help investors compare returns with the uncertainty or downside exposure involved in producing them.
For example, the Sharpe ratio compares excess returns with overall return volatility.
The Sortino ratio focuses on downside volatility rather than all fluctuations.
However, these metrics have limitations.
Their usefulness depends on the quality of the underlying data, the evaluation period, and the assumptions used.
Investors should therefore avoid relying on a single performance score.
Practical Questions to Ask Before Trusting Results
Before evaluating an AI trading service, investors should seek clear answers to several questions:
- Are the published returns simulated or based on real transactions?
- What period do the results cover?
- Do the figures include trading fees and execution costs?
- What was the largest historical drawdown?
- Were the models tested on unseen market data?
- Can an independent party verify the trading records?
- How did the strategy behave during unfavorable market conditions?
Clear, documented answers provide a stronger basis for evaluation than promotional claims.
Conclusion
Understanding how to evaluate AI trading performance requires examining much more than advertised returns or sophisticated model descriptions.
Backtesting can reveal how a strategy behaved under historical conditions, while verified live records provide evidence of actual trading activity.
However, both require careful interpretation.
By examining drawdowns, transaction costs, model validation methods, reporting transparency, and potential warning signs, investors can make more informed assessments of AI-powered trading services.
Ultimately, credible performance evaluation depends on verifiable evidence, realistic assumptions, and a clear understanding that past results cannot guarantee future investment outcomes.